Analytics: Queues Dashboard
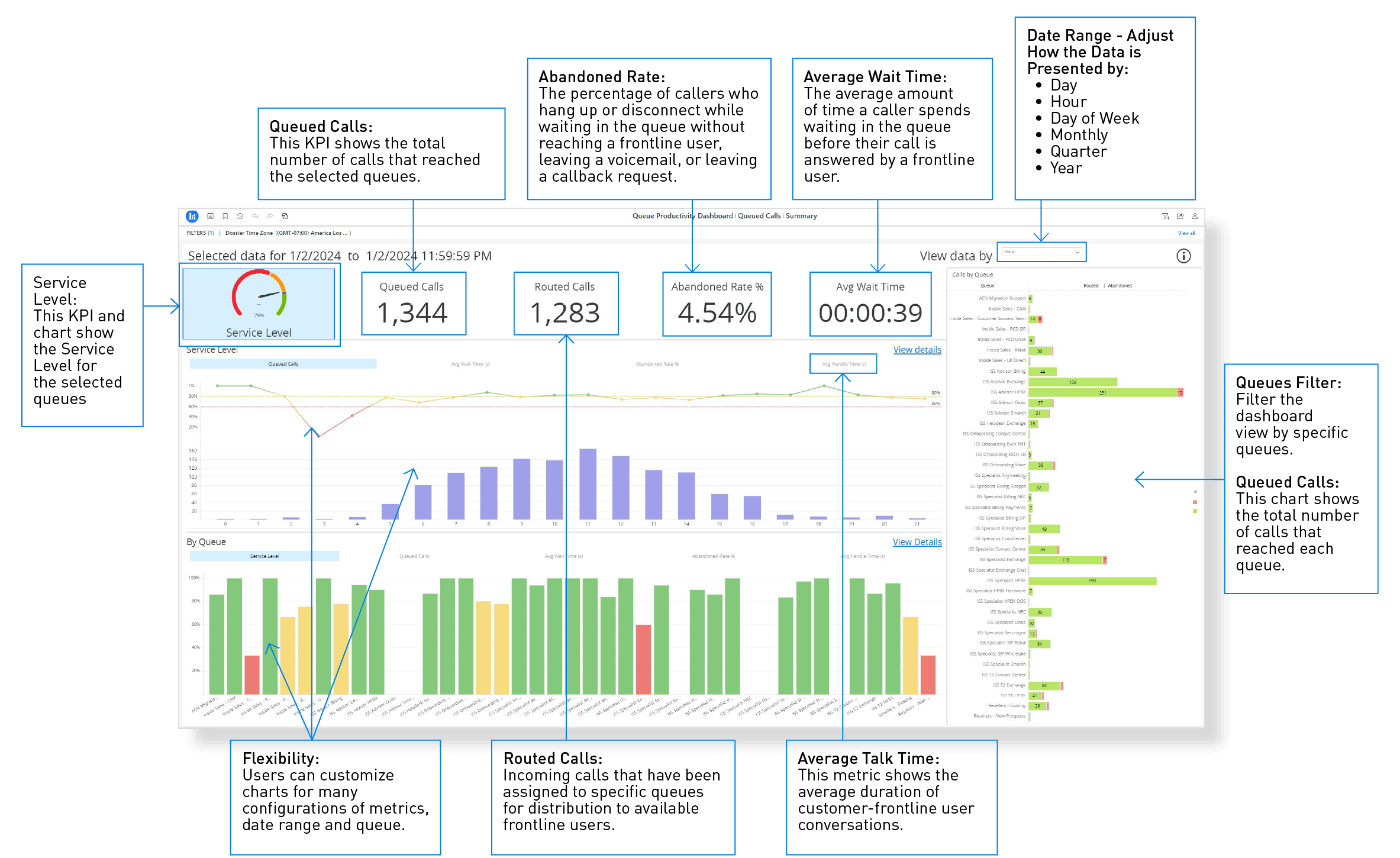
Intermedia's Contact Center Queues Dashboard provides easy-to-consume, graphical views of historical call queue performance. It offers essential metrics such as service levels, average talk times, and abandoned calls that allow managers and supervisors to gain valuable insights into the efficiency and effectiveness of their Contact Center queue performance. The Queues Dashboard is customizable to give users increased flexibility to modify the view, date range, and data presentation preferences as well as filter by queues.
Additional benefits of the new dashboard include:
Focus on What's Important: Supervisors can personalize their dashboard, focusing on key performance indicators (KPIs) that matter most to them. Customization lets them track metrics like wait times, handle time, and abandon rates. They can also set and monitor service levels that match their needs, ensuring customer expectations are met. Data drill-down options offer deeper insights into queue performance, helping supervisors identify areas needing improvement and make data-driven decisions for better efficiency and customer satisfaction.
Easily Create Awareness: The data can be downloaded in Excel or PDF formats and shared, or it can be scheduled for automatic email distribution (automatic email distribution will be available at launch or shortly thereafter).
Improve Your Customer Experience: Enables supervisors to quickly grasp performance trends, allowing them to proactively address issues and deliver a more fluid and satisfying customer experience.